
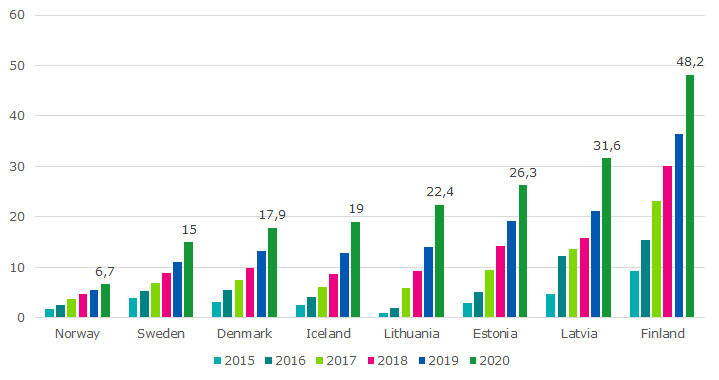
In 2020, Finns were still the most active users of mobile data with a monthly data usage of already almost 50 gigabytes. The increase in the use of mobile data has also been quite rapid in the Baltics. In Sweden, Norway, Denmark, and Iceland, the availability of fixed broadband in households varies between 88 and 95 per cent, while in Finland the availability was 65 per cent at the end of 2020. In these countries, material investments in telenetworks is also at a higher level than in Finland and the Baltics, reports the communications statistics comparison between Nordic and Baltic countries, which is published annually by the Finnish Transport and Communications Agency Traficom. Traficom monitors the development of communications networks and services and publishes related information for the public for the purpose of monitoring the communications market and foreseeing any changes in it.
For several years now, Finland has been at the top of the Nordic-Baltic statistical comparison when it comes to statistics about the number of mobile subscriptions and their use. In 2020, Finns used an average of 48 gigabytes of mobile data per capita per month, while in Norway the corresponding figure was less than 7 gigabytes. “According to our consumer research, 43% of Finnish households only had the use of mobile broadband. Additionally, in Finland the use of data is not restricted by the subscription contracts, which in part also increases data transfer amounts,” says Senior Specialist Elina Pallas. Data transfer amounts have increased quickly not only in Finland, but also especially in the Baltic countries.
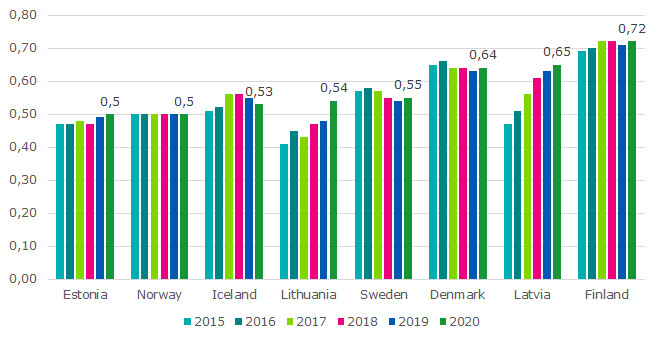
The importance of mobile broadband could also be seen in the number of subscriptions in Finland. Finland still had the most broadband subscriptions per capita, which is explained by the popularity of mobile broadband. Finns had 0.38 of these mobile subscriptions intended only for the transfer of data per capita. In Latvia and Lithuania, the number of mobile broadband subscriptions per capita has increased rapidly, while in other countries the development has been steady and the annual changes moderate.
Fast fixed broadband is not as easily available in Finland and the Baltics
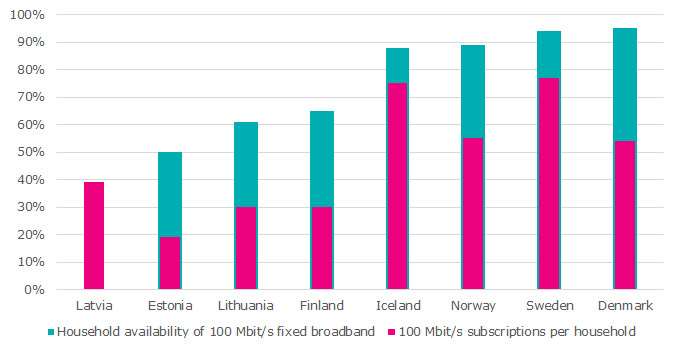
There were still significant differences in the availabilty of fixed network broadband between the different countries. With the exception of Finland, a fixed network subscription capable of a download speed of at least 100 megabytes was already available to almost 90% of households in the Nordics, with Denmark leading the statistics with a 95% household coverage. In Finland, 65% of households had this kind of fast fixed broadband available at the end of 2020. The annual increase of the household coverage of fast fixed broadband in Finland has been about a couple of per cent.
Sweden was at the top of the statistics in its implementation of fast fixed broadband subscriptions capable of a download speed of at least 100 megabytes: there were 0.77 fast fixed broadband subscriptions per household. The number of used fast fixed broadband subscriptions has increased steadily in all of the observed countries. The increase has been particularly quick in Norway and Denmark. In Finland, there were 0.30 fast fixed broadband subscriptions per household.
Investments connected to high availability of fixed network
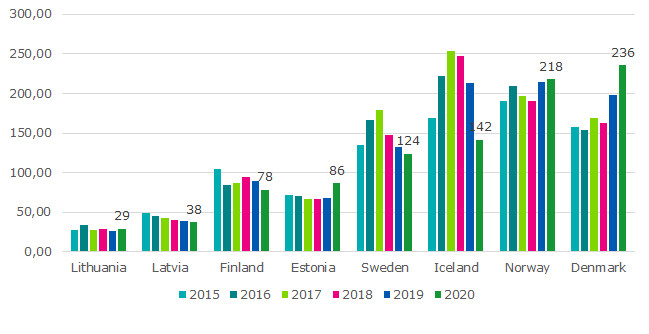
In the amount of material investments into telenetworks, Finland is located somewhere between other Nordic countries and the Baltics. Material investments mainly mean network building costs. Material investments in Finland during 2020 were 78 euros per capita, while in Norway the figure was 218 euros and in Sweden and Iceland more than 100 euros. In Sweden and Iceland, the investments have begun to decrease after a long period of increase, which explains why the availability of fixed networks is already at a high level.
The presented figures are based on statistics compiled by the telecommunications regulatory authorities in the compared countries.
Additional information
Read more about the statistics in the presentation (External link) on Traficom’s website.
The Swedish Post and Telecom Authority (PTS) publishes the statistics (External link) on its website.
Senior Specialist Elina Pallas, Tel. +358 (0)29 539 0126, elina.pallas@traficom.fi