In Finland, the use of the internet relies on mobile networks more than in other Nordic countries
In 2022, Finland used the most mobile data transfer per inhabitant compared to other Nordic and Baltic countries, according to telecommunications statistics published by the Finnish Transport and Communications Agency Traficom and other countries' authorities. Finland also has the most broadband connections per inhabitant, but when it comes to the availability of fixed network, Finland falls short of the top.
In Finland, more mobile data transfer per inhabitant was used again last year than in other Nordic and Baltic countries. This can be seen from the information from 2022 that was collected by the country's authorities from telecommunications companies. 63 gigabytes of data were transferred per inhabitant in Finland's mobile networks per month. The second largest amount of data was transferred in Latvia, where 49 gigabytes of mobile data was transferred per inhabitant per month. The least amount of mobile data was transferred in Norway, where the number per inhabitant per month was 10 gigabytes.
The reason behind the large amount of mobile data transfer is that, due to comprehensive mobile networks and unlimited data transfer, many Finnish households only use mobile internet both on mobile devices and on other devices in the home, for example with the help of a 4G or 5G modem. In many other countries, a fixed connection in the home is used more often, which is used for services that consume more data, such as streaming videos with a sharp image quality on a large screen.
The majority (59%) of data transfer in Finnish mobile networks took place from so-called mobile broadband connections, i.e., connections that do not use voice services at all. These connections are used, for example, in modems and tablets. At the end of 2022, Estonia, Finland and Lithuania had more mobile networks per inhabitant than in the other comparison countries, which can be explained by the number of networks only in data transfer use. In other countries, the majority of mobile data transfer came from smartphone networks, e.g., in Norway even up to 84%, because mobile networks are mainly used when moving around outside the reach of fixed networks.
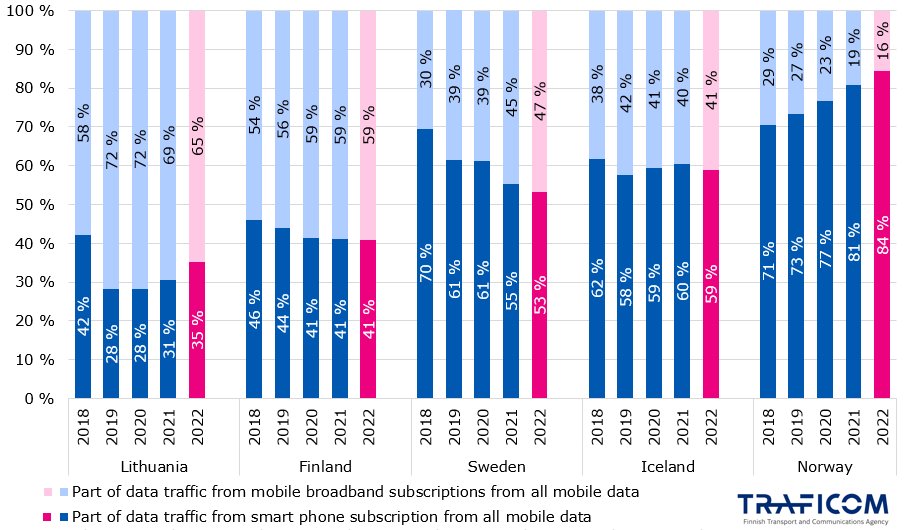
Figure 1. Distribution of data transfer in mobile communication networks between smartphone networks used for voice and data transfer and mobile broadband networks only used for data transfer. Including countries that divide the amount of data transfer based on the type of network.
The availability of fixed networks in Finland is lower than in other Nordic countries
At the end of 2022, broadband networks that reached 100 Mbps maximum were available to 73% of Finnish households. In the other Nordic countries, the figure was over 90%, and only in Lithuania, less than 70% of households were covered by these fast fixed networks. Especially due to extensive fibre optic investments in Sweden, the availability of high-speed fixed networks to households has been over 90% for several years.
The goal of the European Union's Digital Decade action program is that by 2030 all households should have a network with a download speed of at least 1 Gbit/s. Traficom promotes this goal in Finland, among other things, by granting support for the construction of broadband networks in areas where networks are not built on market terms.
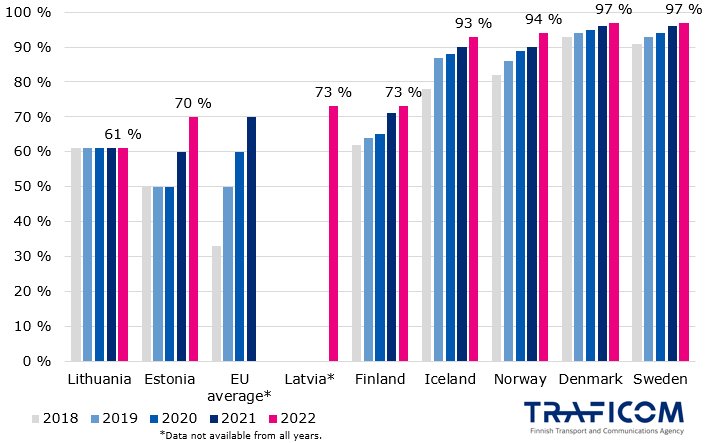
Figure 2. Household availability of a fixed internet connection with a maximum download speed of at least 100 Mbit/s.
At the end of last year, fibre optic connection was available to 96% of households in Sweden, while in Finland the share only rose to over 50% in 2022. Fibre optic availability in Denmark and Norway was also weaker than in Sweden, because, like in Finland, high-speed connections are available to a large part of households in these countries with Internet connections based on the cable TV network. In contrast to the fibre optic network, cable TV network connections usually cannot offer high transfer speeds from the user to the network. This can somewhat slow down the use of, for example, cloud services. In terms of fibre optic availability, Finland was the last of all the Nordic and Baltic countries. Currently, regarding fixed network, fibre optic technology is the implementation method that is being built the most and with the help of which, among other things, the EU's goals are being achieved.
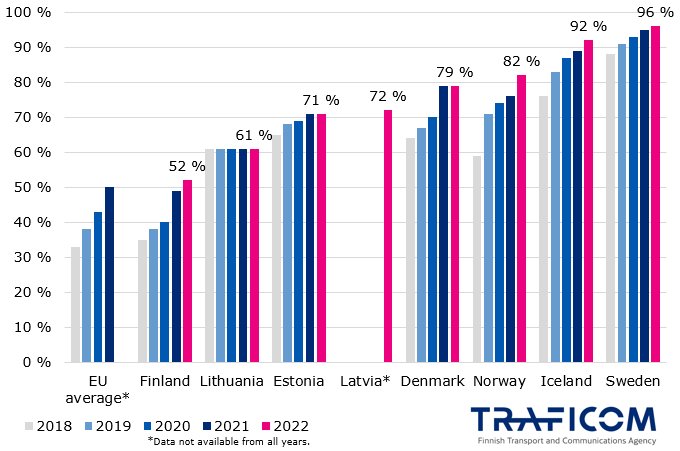
Figure 3. Availability of a fixed fibre optic connection to households.
Finland has the most broadband connections
When adding up all fixed and mobile broadband connections, there were 0.73 connections per inhabitant in Finland at the end of last year, which was more than in any other Nordic or Baltic country. Denmark had the second highest number of broadband connections, 0.7 per inhabitant. The fewest such connections were in Latvia, where there were 0.47 fixed or mobile broadband connections per inhabitant. These numbers therefore do not include smartphone connections.
Finland had the third lowest number of fixed network broadband connections per household among comparison countries, 0.68 per household. Norway had the most fixed broadband connections at the end of 2022, 0.96 per household, i.e., almost every household had a fixed broadband connection. Norway was followed by Iceland and Denmark. 92% of all fixed broadband connections in use in Sweden had connections with a maximum download speed of at least 100 megabytes, while the share in Finland was 51%. In Iceland, 86% of the connections in use were at least 100 megabytes, but fixed networks in the country are also partly sold with unlimited speed and a limited amount of data transfer.
The number of connections implemented with fibre optic technology has grown and continues to grow as old fixed networks are upgraded to fibre optic technology and a completely new fibre optic network is built. In all Nordic and Baltic countries, the number of old copper connections has decreased and copper connections have been replaced by fibre optic connections, among other things. At the end of 2022, more than 80% of the fixed broadband connections in use in Iceland and Sweden were implemented with fibre optic technology.
As with network availability, the number of connections also shows that in Finland, Denmark and Norway, high-speed connections are also implemented with cable TV network connections. In Norway, 70% of all fixed broadband connections, in Finland 63% and in Denmark only 49% were implemented with fibre optic technology. In all comparison countries, however, the number of fibre optic connections has grown steadily since the start of the statistics in 2016.
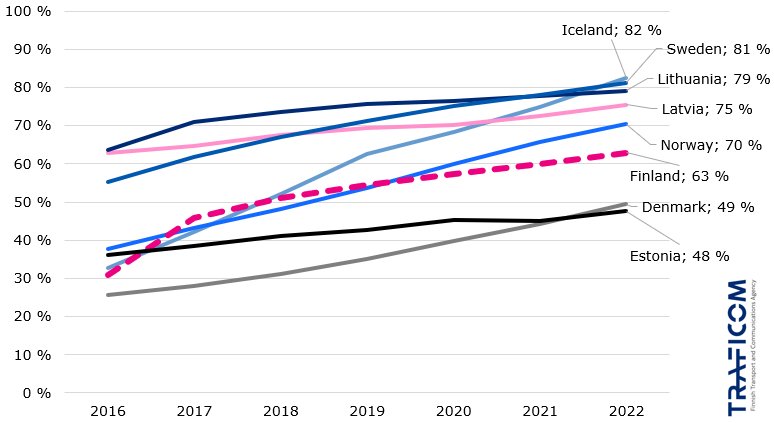
Figure 5. The share of fixed broadband connections implemented with fibre optic technology out of all connections.
The figures presented are based on statistics compiled by the authorities of the countries involved in the comparison. Traficom produces versatile statistics from the communication and transport markets for, among other things, consumer information and market monitoring.
Further information
Presentation describing the statistics on Traficom’s web page (in English).
The Swedish Post and Telecom Authority (PTS) publishes the statistics on its website (in Swedish and English)
Communications Market Specialist Marja Heinonen tel. +358 29,534 7355, marja.heinonen@traficom.fi