
According to a consumer survey on the use of communications services conducted by the Finnish Transport and Communications Agency Traficom in spring 2021, most consumers use the internet for video streaming services and various music and listening services. Up to 85% of consumers used these services this spring. Online and video calls, which gained popularity last year due to the COVID-19 pandemic, continue their popularity among users. Conversely, less than 50% of consumers ordered home deliveries of food or goods online monthly despite the pandemic.
Many of our everyday services operate online and new services are going digital each year. The annual consumer survey by Traficom examines how many different communications services are used by Finnish consumers. We monitor the development of digital services in Finland actively to map the current status and future needs of these services.
Consumers favour Finnish free-of-charge streaming services
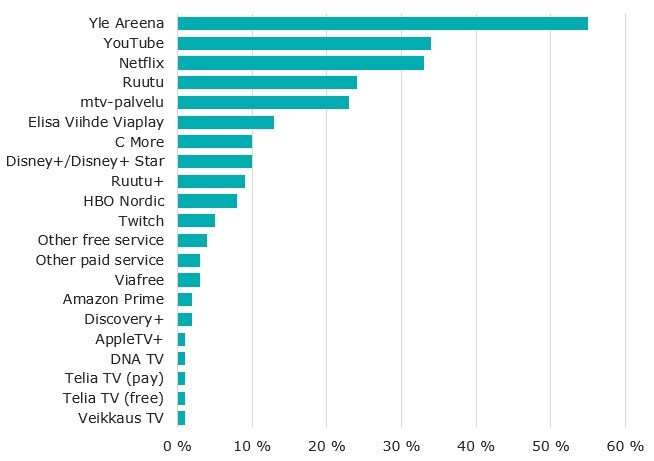
Watching TV series, films and live TV has also migrated to different applications to some extent. Over the past three months, 78% of consumers had watched at least one free-of-charge streaming service or streaming service subject to a fee. Nearly half of consumers had watched live TV broadcasts via free services and 65% had used these services to view recordings, TV programmes or films. Fifty per cent of consumers had subscriptions to a streaming service subject to a fee or a free trial of such a service.
The most popular services included TV channels’ own free-of-charge services, YouTube and Netflix. The ‘other’ field in free services contained TV services offered by various newspaper media.
Music most popular online
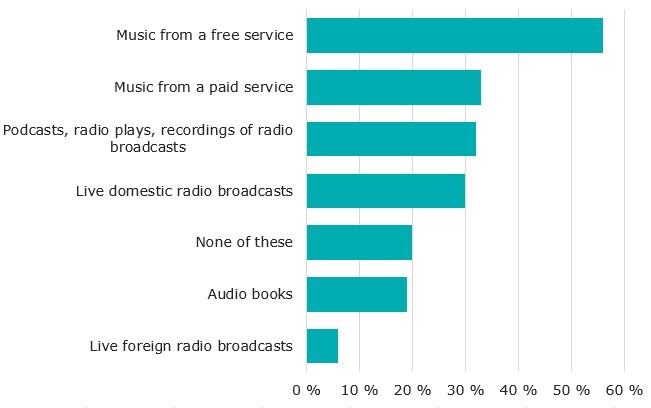
The Traficom consumer survey contained questions concerning the use of various online audio services during the last three months for the first time in spring 2021. Different music and listening services are as popular as video streaming services, with 76% of consumers having listened to some of these online. The clear winner in what people listen to online via different applications is music: 56% of consumers had used free music applications and 33% had used music applications subject to a fee.
Thirty per cent of consumers had listened to live Finnish online radio transmissions, such as radio channels. Only 6% had used corresponding foreign services. Thirty-two per cent of consumers had listened to various podcasts, recordings or radio plays, whereas 19% had listened to audiobooks online and via applications.
Online phone calls remain popular
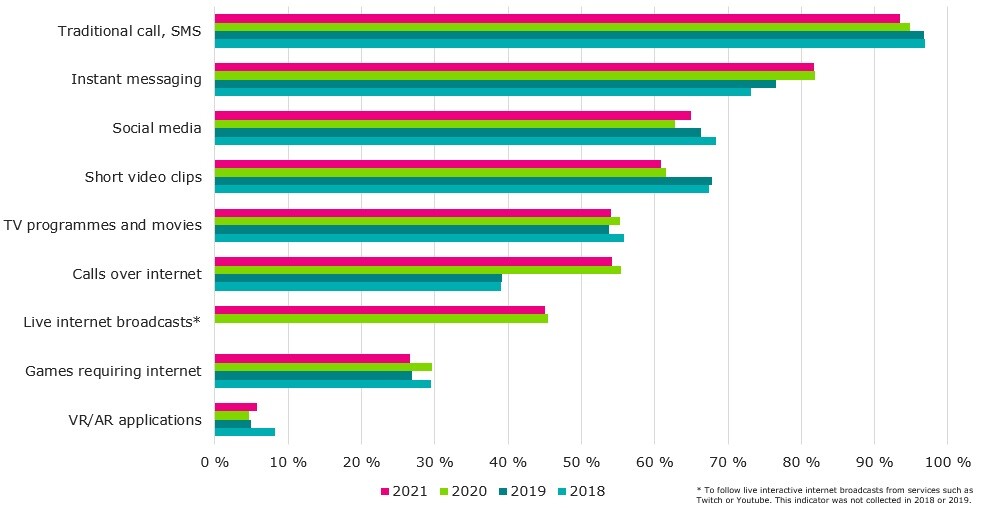
Last year, the Traficom consumer survey showed that online calls and video calls had become surprisingly popular due to the pandemic, as the number of consumers using these services weekly rose to more than 50%. In spring 2021 it would seem that online calls have remained as popular as last year, even though many have undoubtedly suffered from virtual meeting fatigue. Instant messages are also here to stay; more than 80% of consumers continued to send them weekly. Making conventional phone calls and sending text messages continued to decrease, which was also supported by the phone call and text message statistics provided to Traficom by telecom companies.
Only less than 10% of consumers have groceries delivered at home – it is more common to order take-out
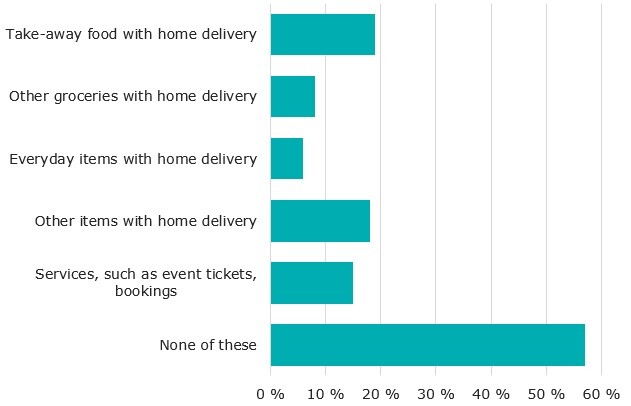
The spring 2021 consumer survey asked whether respondents had food and goods delivered at home via applications or websites. Nineteen per cent of consumers ordered meals from restaurants at least monthly, whereas only 8% had other groceries delivered at home. Even though online grocery purchases are said to have increased significantly during the pandemic, buying groceries online has not become a staple of everyday life for many in the long term. It is possible that respondents thought about their usual behaviour while completing the survey, not their behaviour during the pandemic. On the other hand, the ‘Use of information and communications technology by individuals survey’ from 2020 by Statistics Finland provided similar results on the prevalence of ordering groceries online.
Eighteen per cent of consumers said that they ordered other goods home monthly. For many, ordering goods home monthly may be unusual, but more common over a longer period of time. In the Statistics Finland survey mentioned above, a majority of consumers said that they had made online purchases at some point. Only 15% of consumers said that they ordered various services online monthly, such as event tickets and hotel accommodation. As above, this category may also not show representative results over a short period of time, but the effects of COVID-19 restrictions on travel and cultural events will probably also have influenced the results.
The consumer survey was carried out by IROResearch Oy. The survey involved interviews with 2,001 Finns over the age of 15. The interviews were conducted over the telephone in March to May 2021.
Additional information
Marja Heinonen, Communications Market Specialist, tel. +358 (0)295 390 306, marja.heinonen@traficom.fi
Elina Pallas, Senior Specialist, tel. +358 (0)295 390 126, elina.pallas@traficom.fi
The table of survey results and time series (External link) of the communications services’ consumer survey 2021
The ‘Use of information and communications technology by individuals 2020’ study (External link) by Statistics Finland