
The Frostwing research project was initiated after incidents on transport category airplanes, in which de/anti-icing fluids were suspected as a contributing factor to a stall warning. The research is coordinated with corresponding research by the European Aviation Safety Agency EASA and the Federal Aviation Administration FAA of the United States. The purpose of the research, which is groundbreaking in Europe, is to reduce the use of the de/anti-icing fluids without impairing flight safety.
De/anti-icing fluids
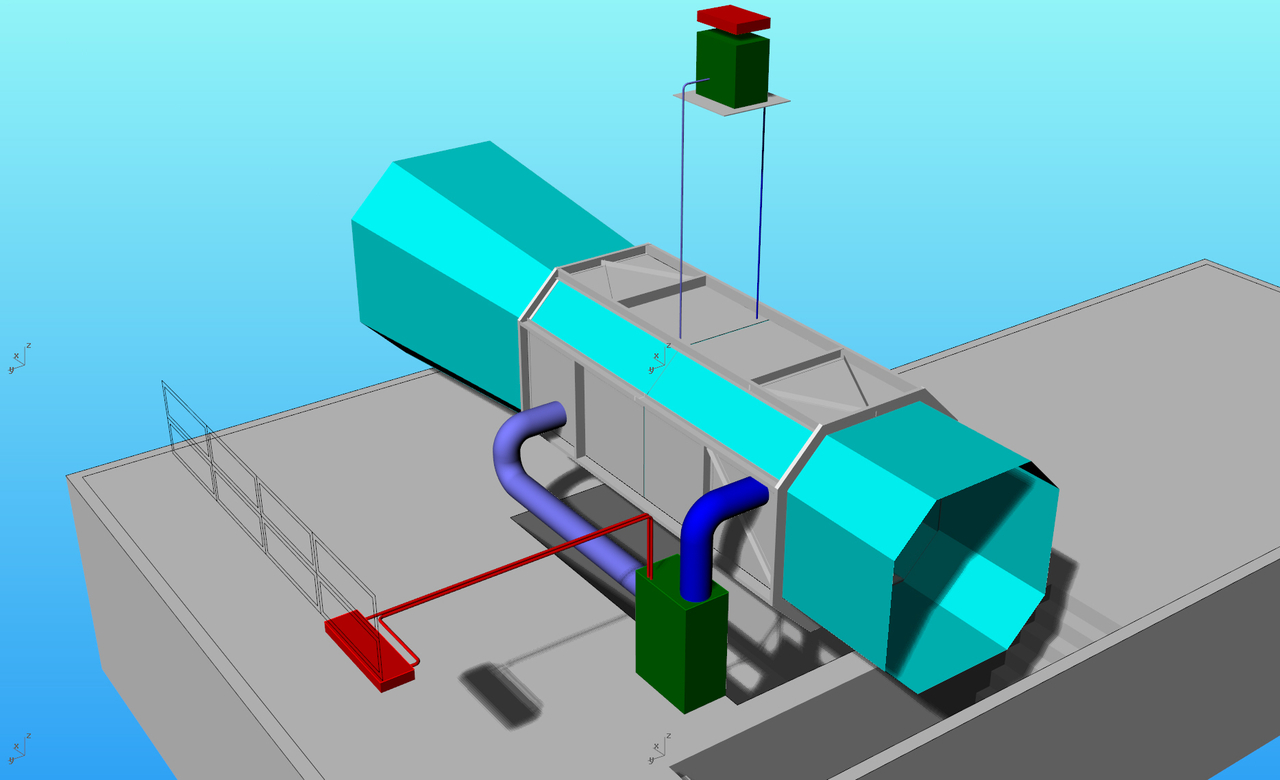
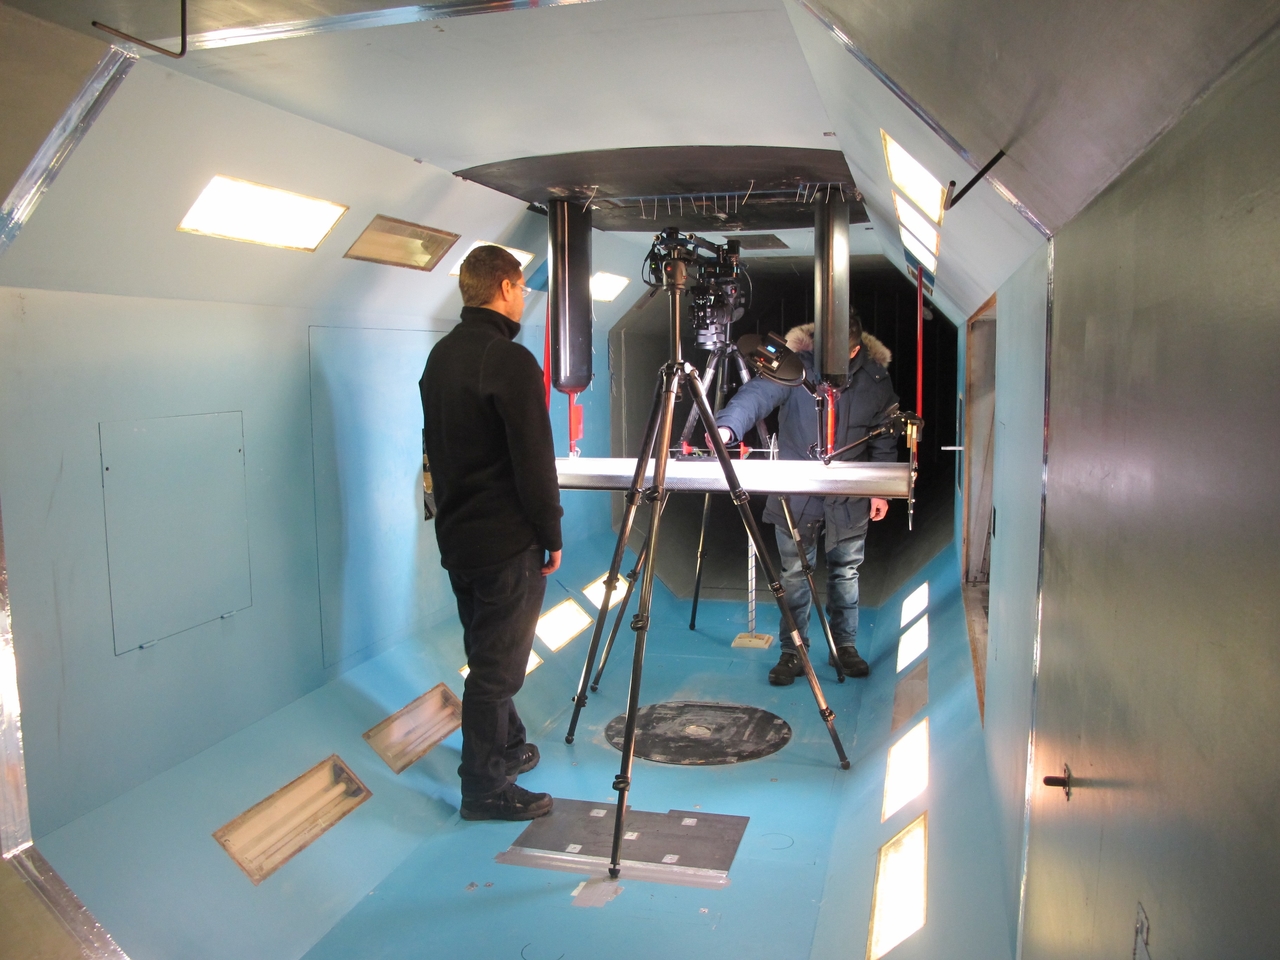
De/anti-icing fluids were tested in wind tunnel to create stylized flow conditions suitable for reference case comparisons. The figures below show the test setup.
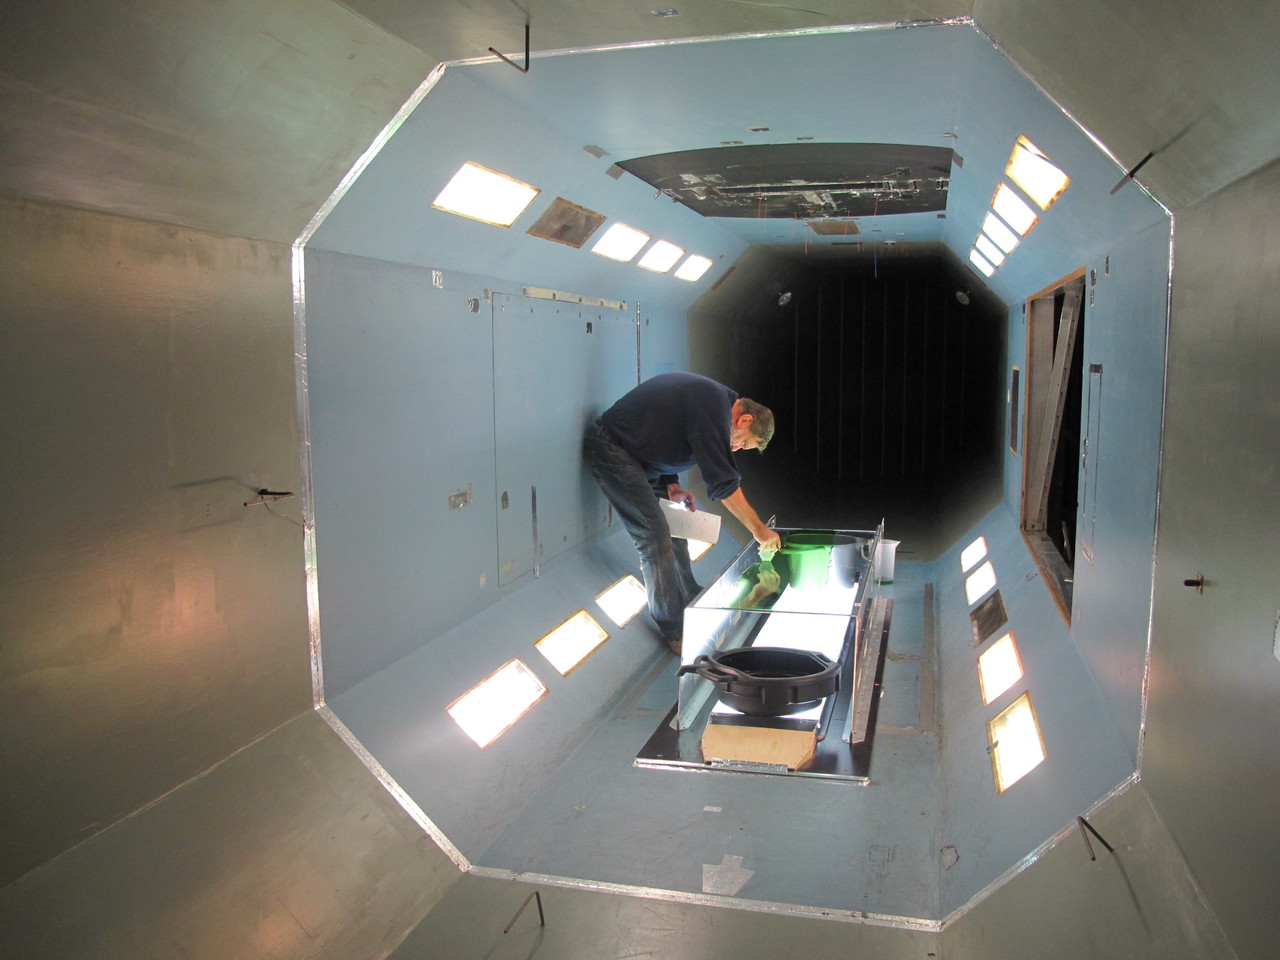
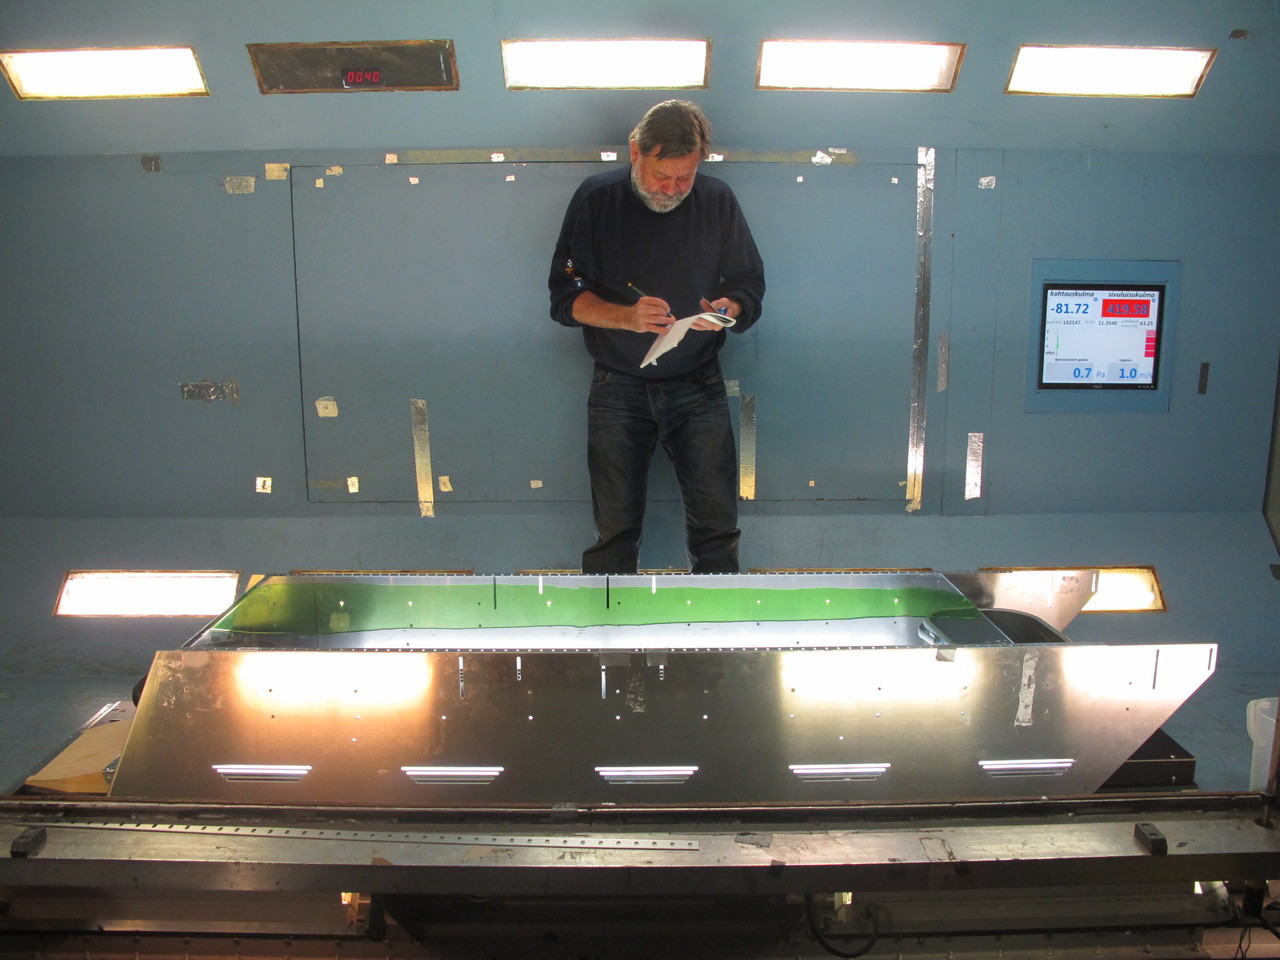
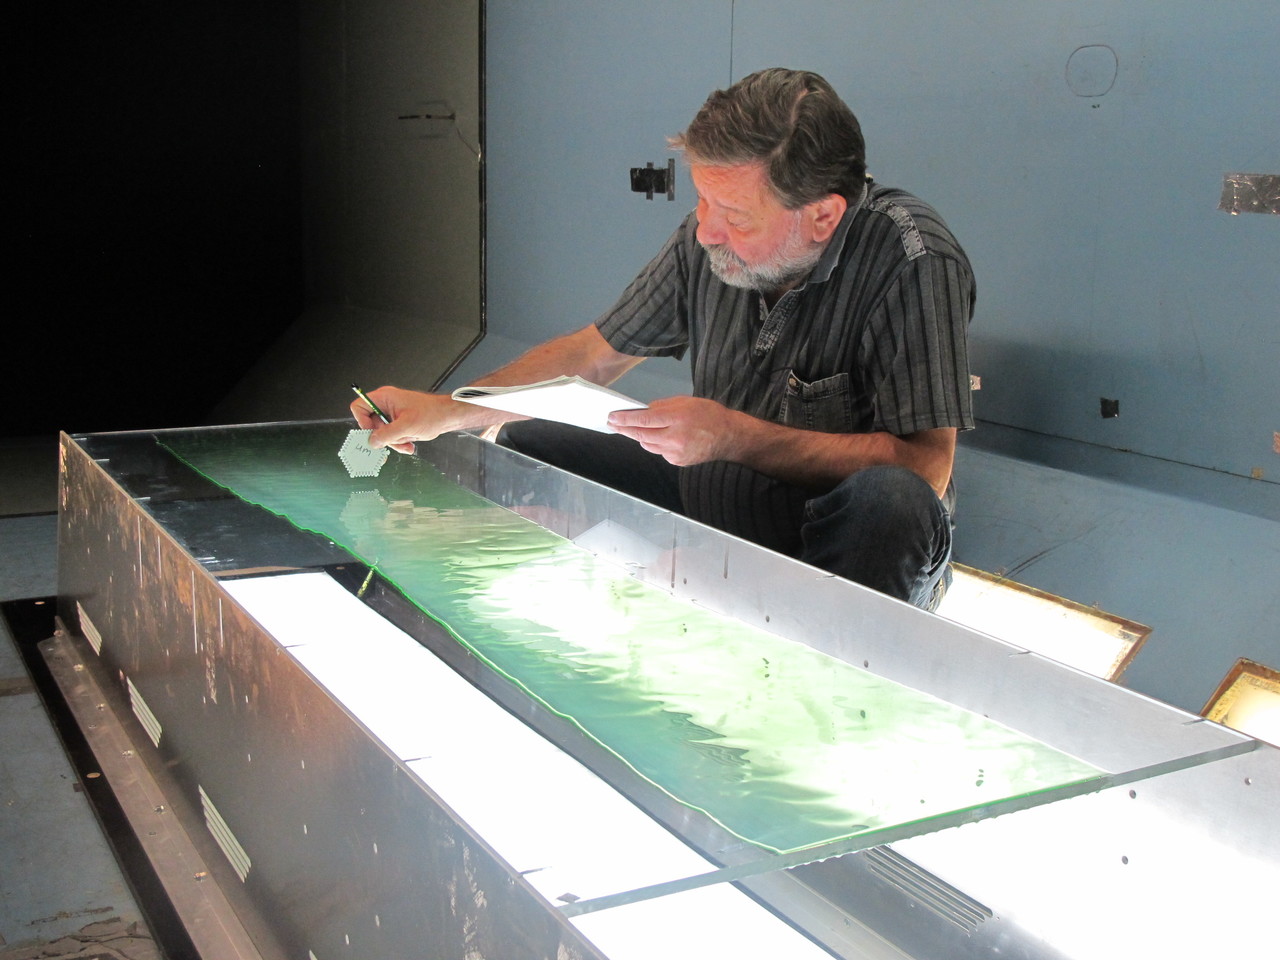
The video below shows the Type IV fluid behavior when simulating an aircraft take-off sequence with accelerating velocity. The flow direction is in the video from the right to the left and the speed is indicated in meters per second. Note the wave formations and ripples in the fluid.
Video of frostwing flat plate type IV fluid (External link)
The animation below shows a 2D CFD computation of Type I fluid on a flat plate using a Large Eddy Simulation LES model. The flow direction is from the left to the right. The fluid is indicated with the red color at the bottom and the fluid thickness is scaled up with a factor of 7. The upper part of the animation shows the velocity distribution of the passing air in meters per second with vortex formation over the fluid waves. Note the qualitative similarity of the wave formations in the computation and the wind tunnel test case above. The calculation time for the 5 second event is about 2 weeks. For the details of the calculation see Trafi Research Report 5/2015.
Animation of LES calculation of Type I fluid on flat plate (External link)
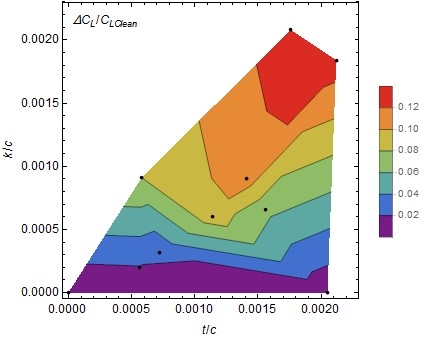
The third video below shows Type II anti-icing fluid on the upper surface of a generic Airbus type DLR-F15 airfoil. The leading edge and slat are at the picture lower edge with the flow continuing towards the flap and trailing edge close to the picture upper edge. Note the secondary wave of the fluid appearing from the slat slot 30 seconds from the brake release just after the model rotation. As most of the fluid has already left the wing surface, the secondary wave is the main cause for the lift degradation. The amount of fluid is automatically scaled in the test by the model slat slot size.
https://www.youtube.com/watch?v=ytLyslnrp7A&feature=youtu.be (External link)
Research on Cold Soaked Fuel Frost
Trafi signed a Research and Development agreement with the United States Federal Aviation Administration on aircraft icing research. During 2015 - 2017 the research is focused on
- Cold Soaked Fuel Frost (CSFF) formation on a wing element
- Laser scanning of CSFF geometry
- Wind tunnel tests on lift degradation due to CSFF during
a take-off
- Wind tunnel reference tests with de/anti-icing fluids on the wing
during a take-off
- De/anti-icing fluid behavior on a flat plate during a simulated
take-off roll
- CFD computations of de/anti-icing fluid behavior
The research is performed in co-operation with Arteform Oy, Dimensium Oy and NASA.
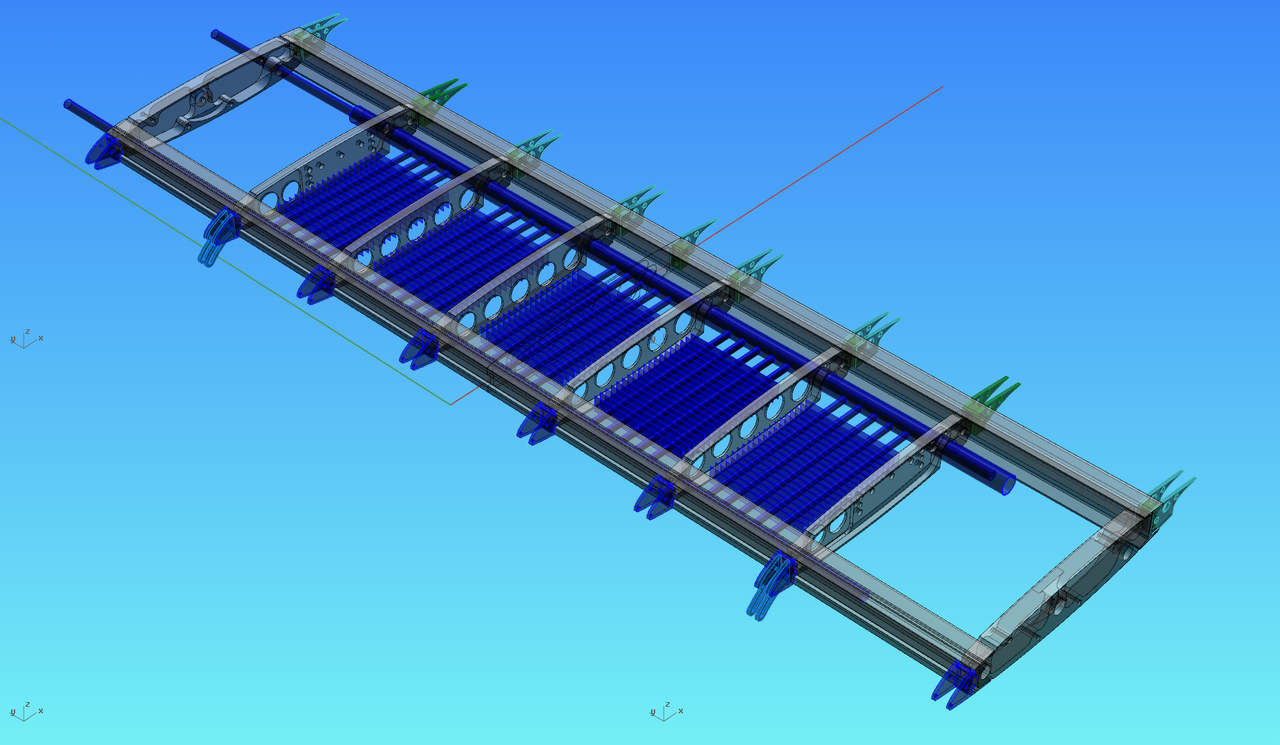
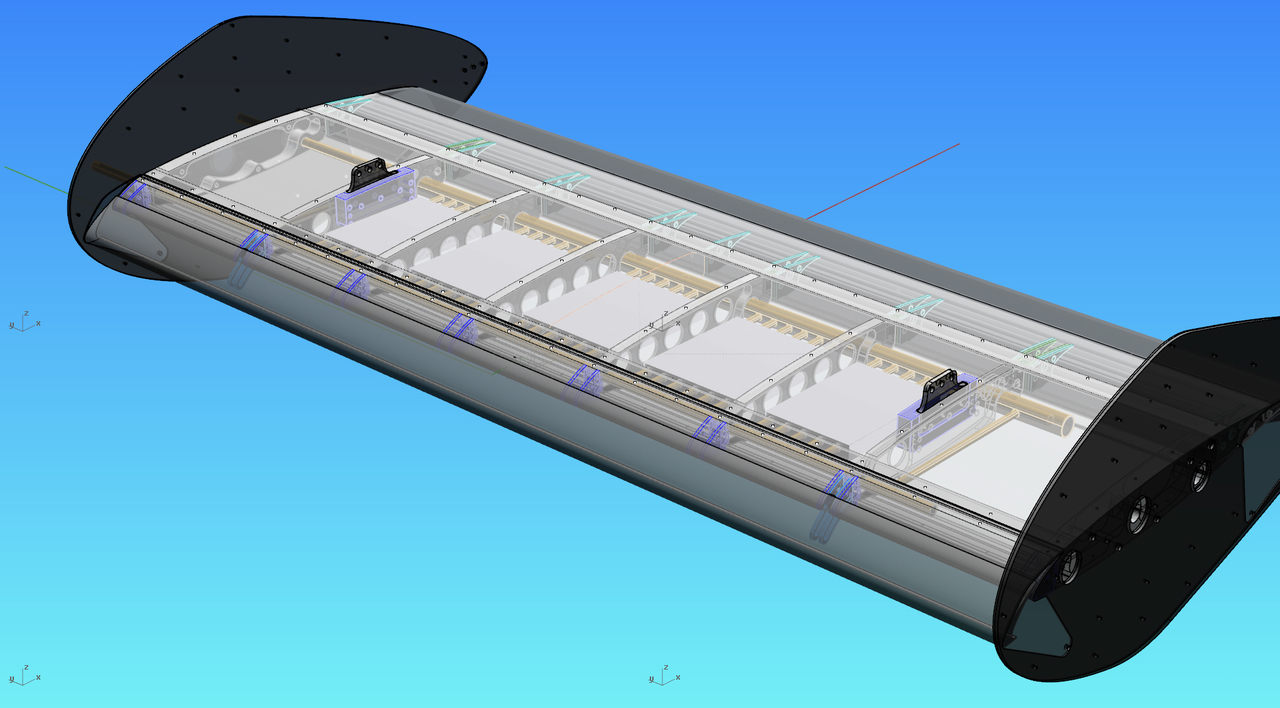
CRM wing model
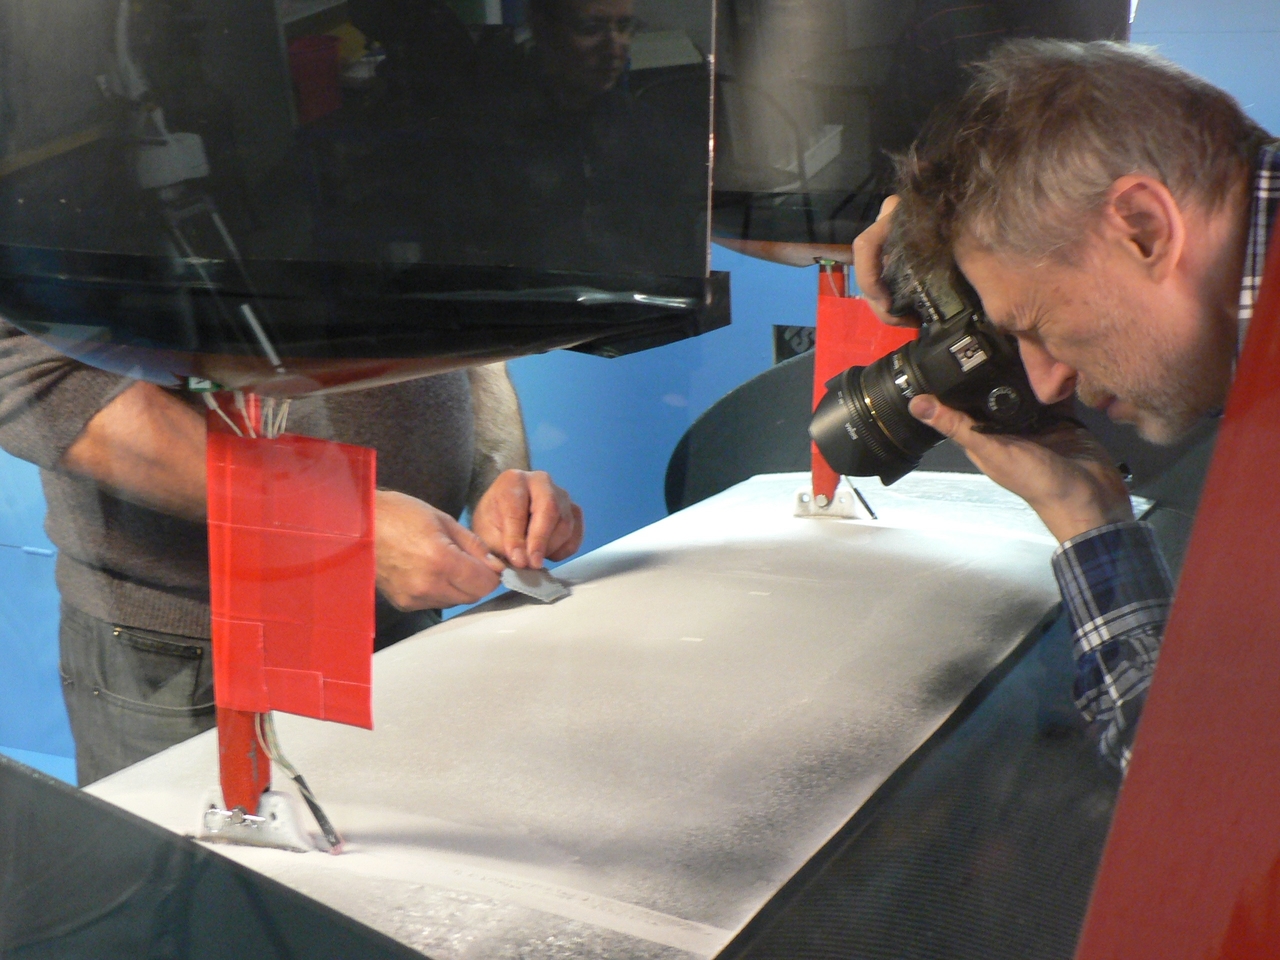
A cooling system was installed in the Arteform operated low speed wind tunnel test section and the wind tunnel model. The 2D wing model has the new NASA/Boeing Common Research Model (CRM) future jet aircraft airfoil geometry (ref. AIAA 2016-0308) and a cooled wing tank to create real CSFF frost. The model has an adjustable slat and flap and can be rotated the same way as in the aircraft take-off rotation. The photographs below show the wind tunnel and model cooling systems and the wing model understructure.
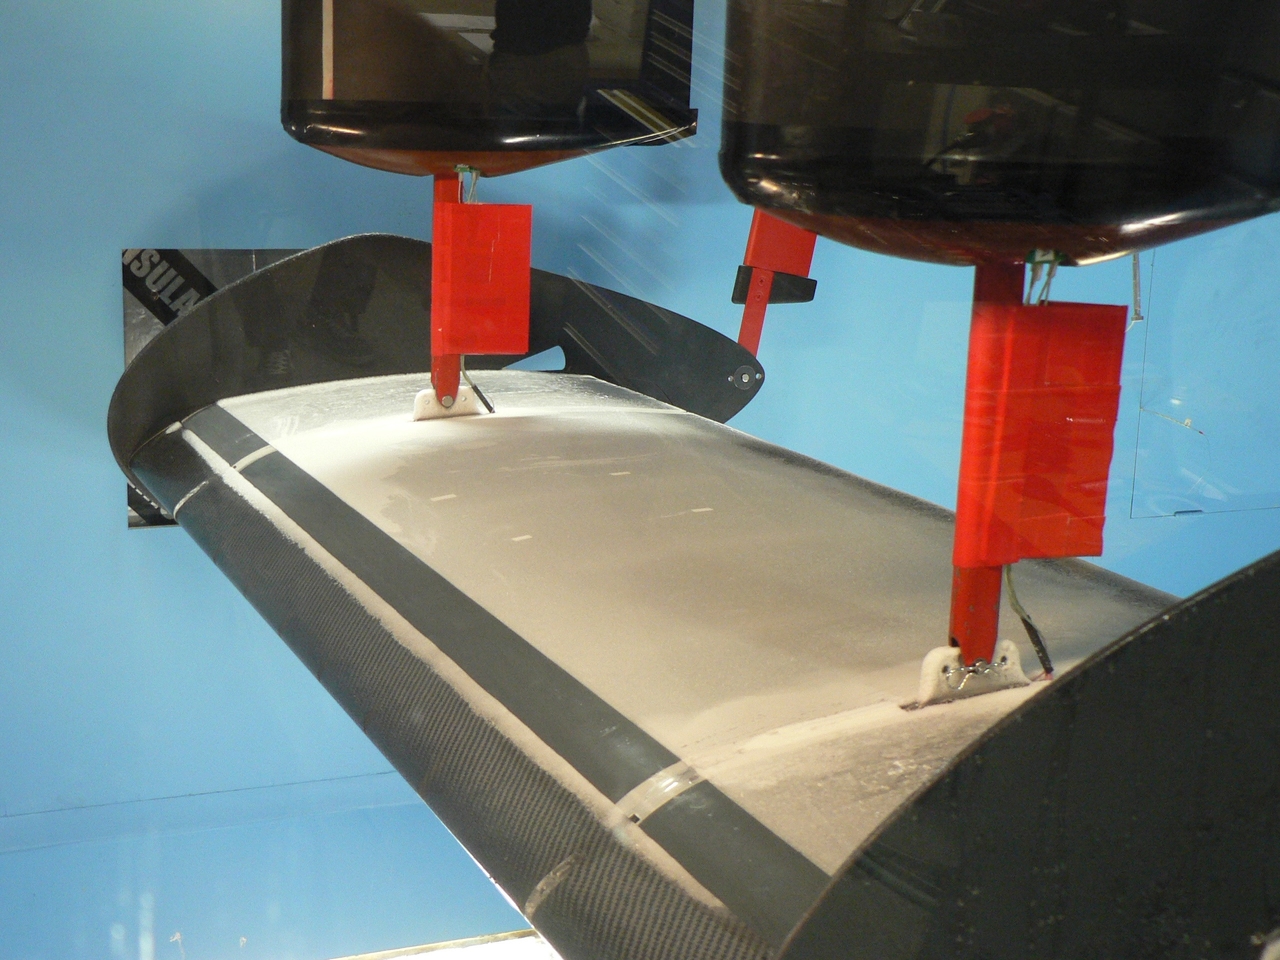
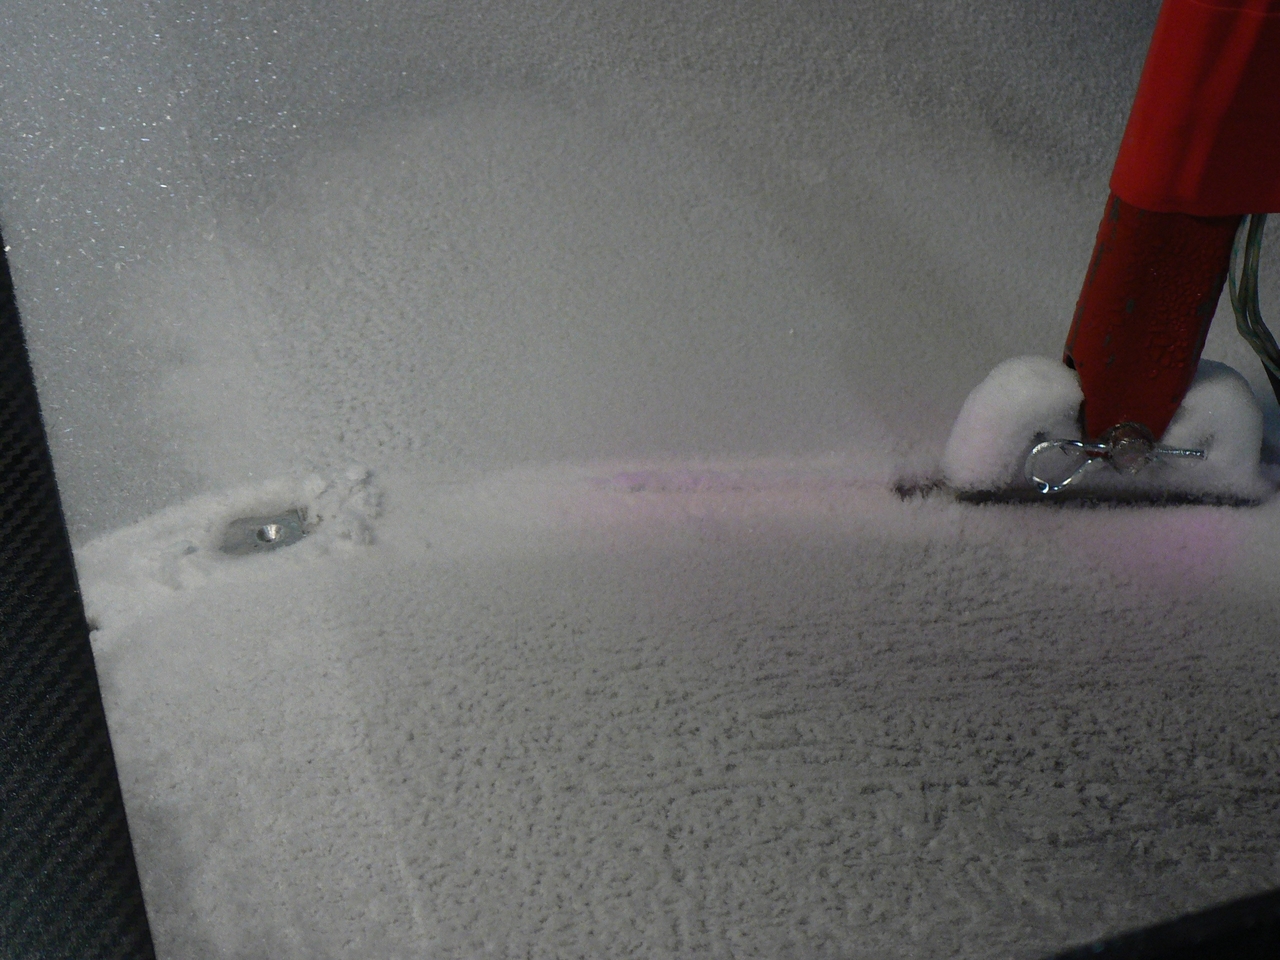
First measurement campaign in September 2016
The photographs below show an overview of the model with frost, a close-up view of the frost, frost thickness measurement, laser scanning and the frost leaving the model surface during the simulated take-off sequence in the wind tunnel.
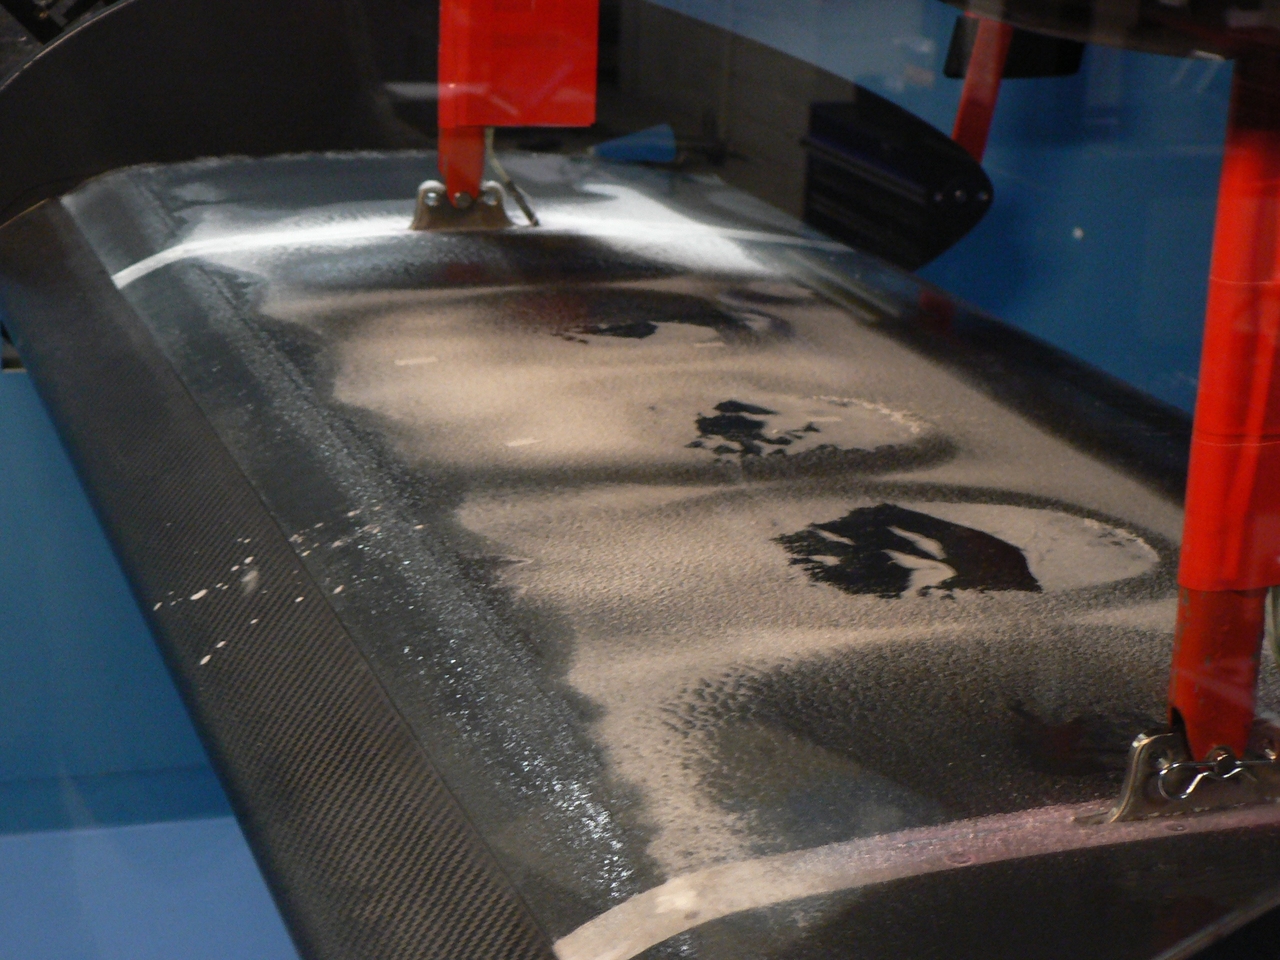
The video below shows how the Cold Soaked Fuel Frost sublimates and melts during a simulated take-off sequence with acceleration on the runway followed by a rotation.
https://www.youtube.com/watch?v=GTx7VtoeFzs&feature=youtu.be (External link)
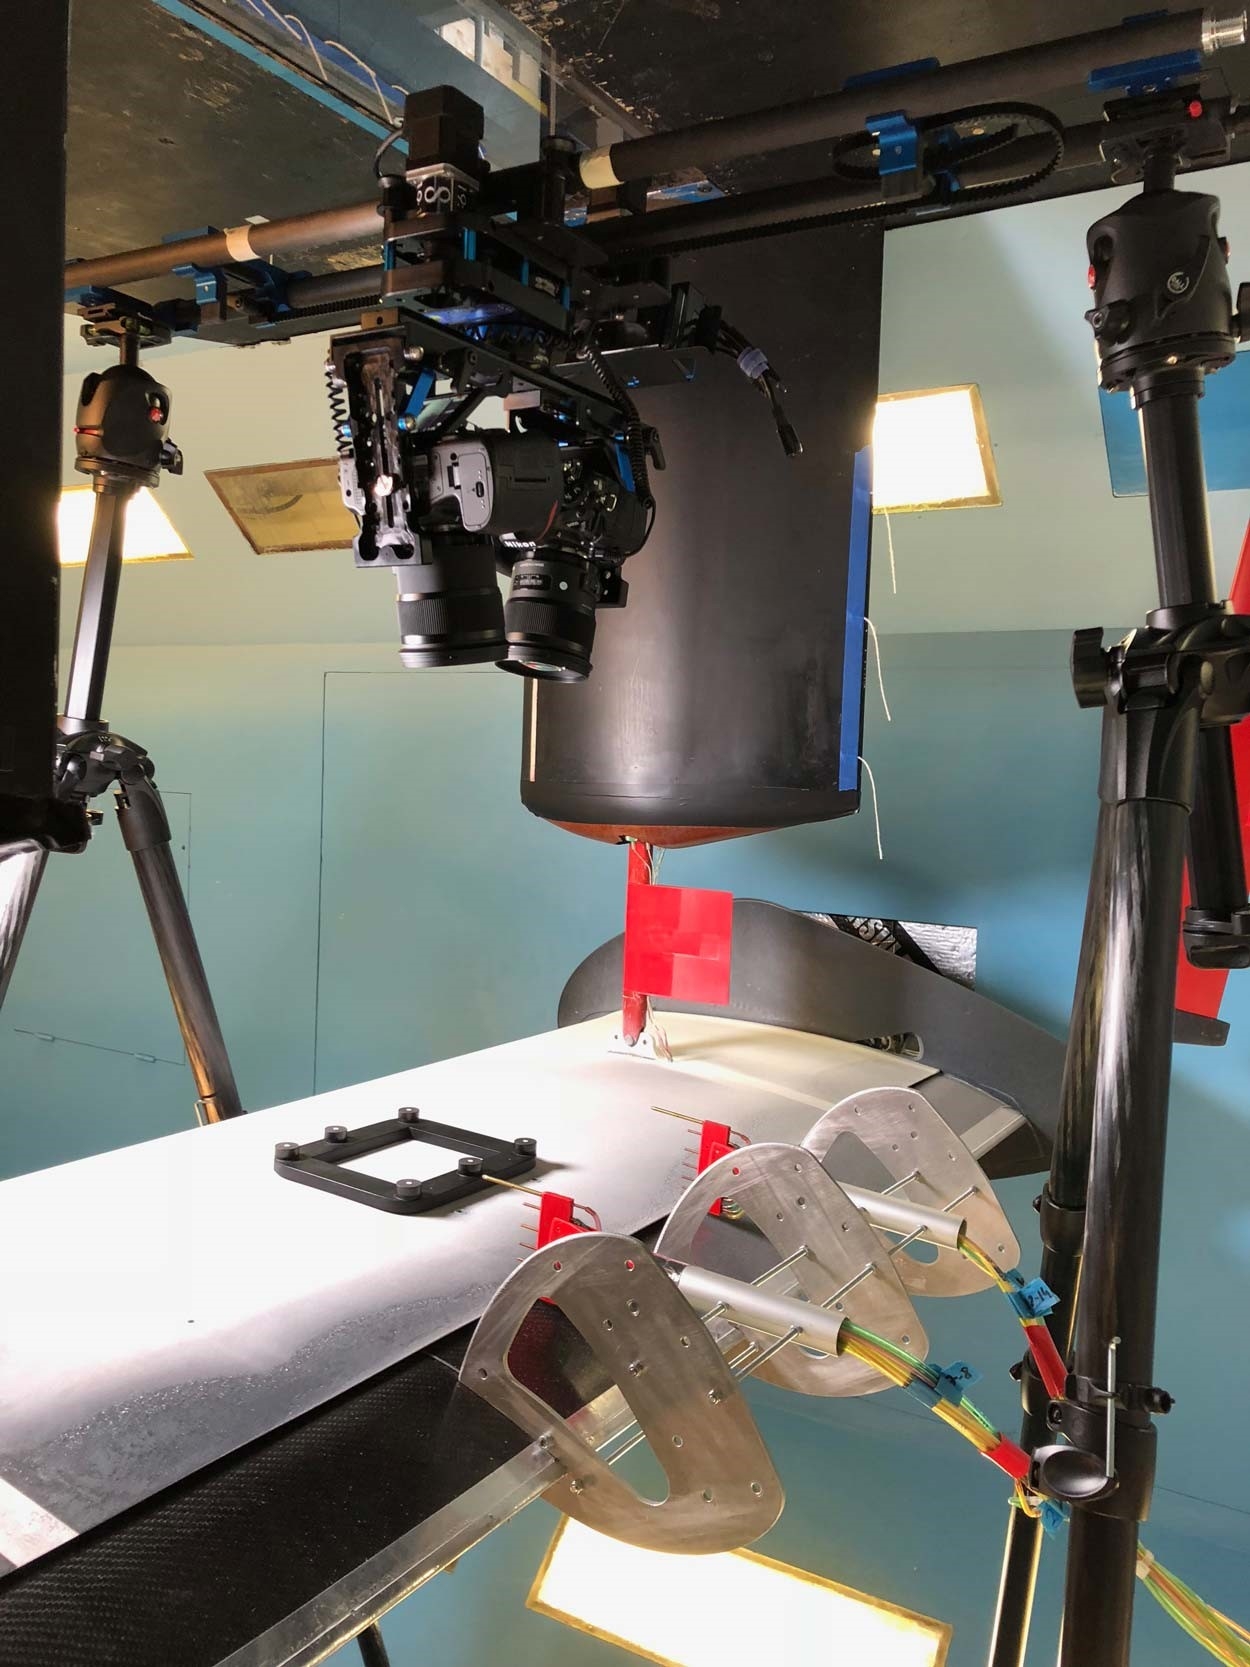
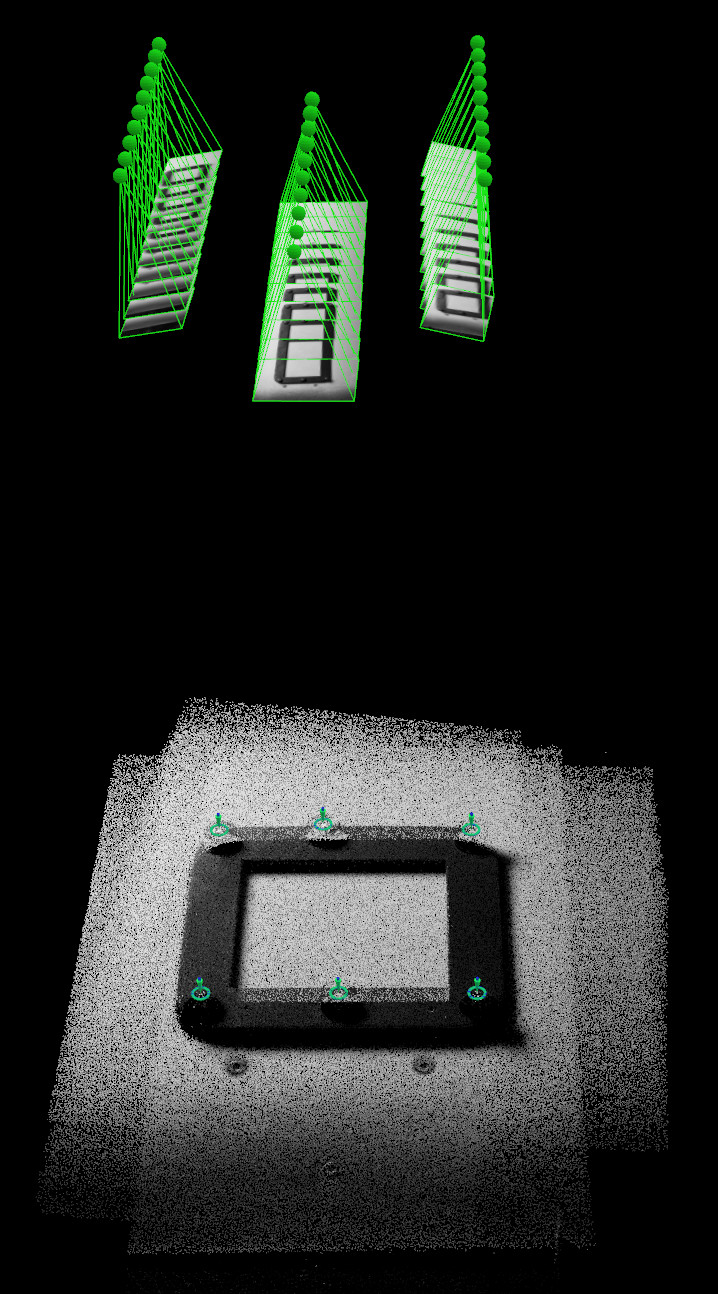
Surface imaging using photogrammetry
Photogrammetry camera system setup
Mechanical Elcometer gauge measurements produce a measure for frost thickness but not for frost roughness. Imaging with laser or photogrammetry provide a surface geometry model. Comparisons of the results, obtained with the two methods, showed a better resolution for photogrammetry. An automatic moving camera system was developed by Dimensioum Ltd, which took the photographs in one minute and the point position resolution was 0.04 mm.
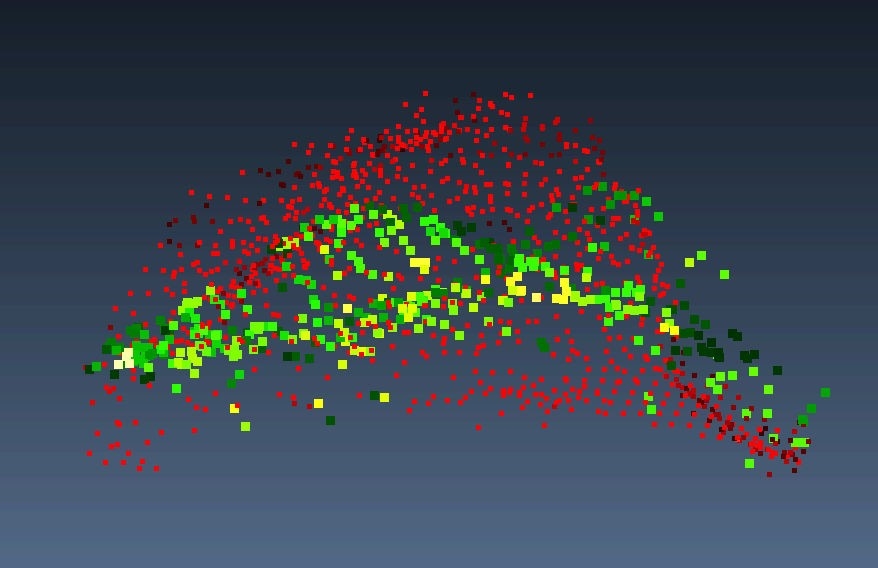
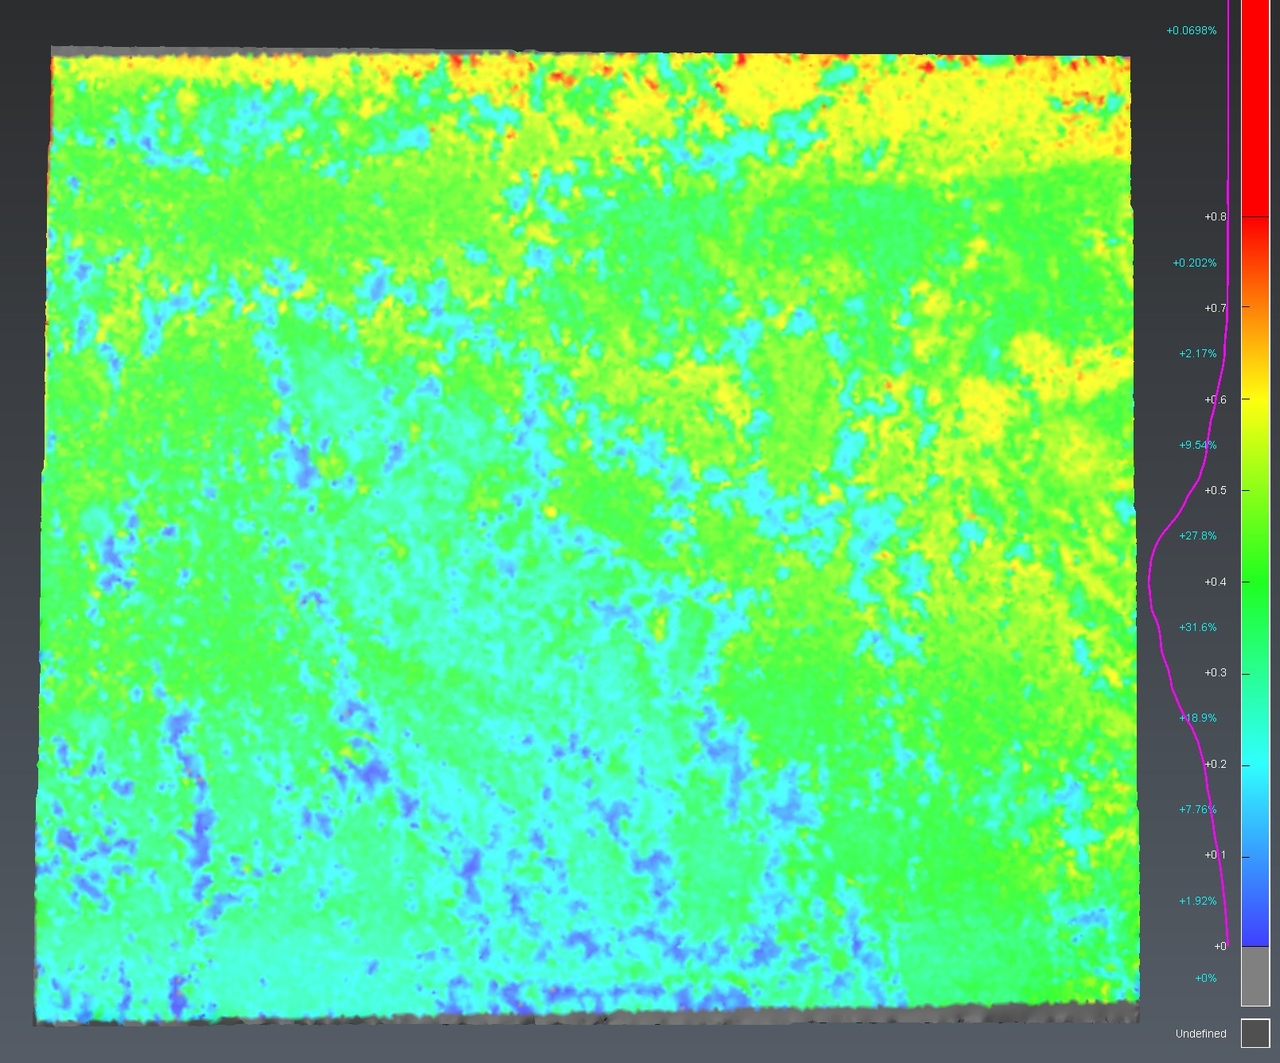
Examples of photogrammetry results
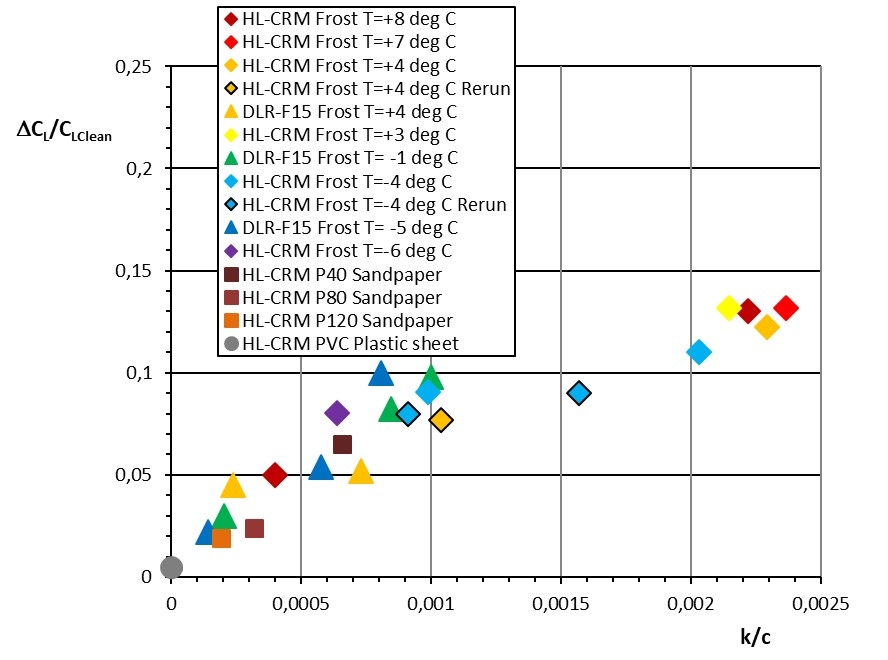
Photogrammetry was performed on Cold Soaked Fuel Frost and for reference sandpaper grains. Comparison of sandpaper results with sandpaper grain standards helped to assess the accuracy of the method. Photogrammetry results on frost surfaces produced surface contour plots from which the average added thickness and Surface roughness could be determined. Calculation routines were also developed to determine rms -values. The added thickness and surface roughness were related to lift loss by corresponding wind tunnel tests of the model wing. Addition of a smooth PVC plastic sheet provided the effect of a smooth added thickness. the photographs below show examples of photogrammetry results. For detailed results see Trafi 2018 reports below.
Frostwing Reports
A Brief Survey on Possibilities to Model the De/anti-icing Fluid Flow Off by an AdHoc Method
Traficom Research Reports 18-2019
Literature Review on Anti-icing and Deicing Fluids Behavior Driven by Airflow
Traficom Research Reports 12-2019
Distributed Roughness Effects on CRM Wing Model
Trafi Research Reports 13-2018
Oil-Flow and Distributed Roughness Experiments on CRM Wing Model
Trafi Research Reports 3-2018
Frostwing Flat Plate CFD Simulations: Reynolds Number Effect and Boundary Layer Analysis
Trafi Research Reports 12-2017
Aerodynamic, Laser and Photogrammetry Measurements on CRM Wing Model with Frost
Trafi Research Reports 11-2017
Technical Reports on Frostwing Flat Plate CFD Simulations
Trafi Research Reports 7-2017
Preliminary Cold Soaked Fuel Frost Studies with CRM Wing Model
Trafi Research Reports 12-2016
Secondary wave lift degradation
Trafi Research Reports 18-2015
A Literature Review on Cold Soaked Fuel Frost Formation and Sublimation
Trafi Research Reports 6-2015
Preliminary CFD Investigation of De/anti-icing Fluid Behavior on a Flat Plate
Trafi Research Reports 5-2015
Effects of Cold Soaked Fuel Frost on Lift Degradation during Simulated Take-off
Trafi Research Reports 4-2015
Effects of Anti-icing Treatment on Lift Degradation during Simulated Take-off
Trafi Publicatios 25-2013
Manual for Airplane Wing Anti-icing Fluid Tests in Wind Tunnel
Trafi Publications 2-2013
Anti-icing Fluid Flow off on a Wing Section During Simulated Taxi and Take-off Run , Appendix A
Trafi Publications 1-2013
Frostwing Presentations and Publications
AIAA Journal, November 2019
Koivisto P., Honkanen T., Auvinen M., Hellsten A., Kahma K.
De-Icing Fluid Flow-Off from a Flat Plate in an Accelerating Airstream
SAE International Conference on Icing, Minneapolis, June 17-21 2019
Koivisto P., Soinne E., Broeren A., Bond T., Frostwing Co-Operation in Aircraft Icing Research
Soinne E., Rosnell T:, Surface Contamination Effects on CRM Wing Section Model
AIAA AVIATION Forum, Atlanta, June 25-29 2018
Soinne E., Rosnell T., Aerodynamic, Laser Scanning and Photogrammetric Measurements of Cold Soaked Fuel Frost
Journal of Aircraft, March 2018
Koivisto P., Soinne E., Kivekäs J., Anti-Icing Fluid Secondary Wave and its Role in Lift Loss During Takeoff
SAE G-12 Aerodynamic Working Group, Montreal, November 1st 2017
Koivisto P., Frostwing Preliminary CFD Results
SAE G-12 Aerodynamic Working Group, Athens, May 19th 2017
Koivisto P., Frostwing Preliminary Results
Soinne E., Frostwing Research Project
SAE G-12 Aerodynamic Working Group, Madrid, May 9th 2014
Soinne E., Icewing III Research Programme
5th AIAA Atmospheric and Space environments Conference, San Diego, June 26th 2013
Koivisto P., Anti-Icing Fluid Flow Off Process on a Wing Section during Simulated Taxi and Take-Off
SAE G-12 Aerodynamic Working Group, New Orleans, May 24th 2013
Koivisto P., Icewing Presentation